Painel de Operações
Monitoring for the company systems became a 3D office: each system is a character, and from across the room, on the wall TV, you can tell who is fine and who is down.
- 71 checks every 30 seconds, across 7 systems and what they rely on outside
- 18 characters, each with a five-step health bar
- Probes only read: none writes, restarts or signs in as another system
How it worked before.
Seven systems run on a single server inside the company, and depend on things nobody there controls: the internet link, the cloud ERP, the tax authority. When something stopped, the user was the one who reported it, at the counter or over the phone.
The cases that hurt most were not even outages. They were systems standing but stuck inside: a queue that did not move, an invoice that did not go out, a scheduled job that quietly stopped running.
What changed.
A collector runs on the server itself and performs 71 checks every 30 seconds: processes, pages, databases, scheduled jobs, public addresses and one-row reads on each ERP subject. It only reads, and keeps the last 24 hours in a database of its own.
The screen started as a control-room board, with cards that stay dark when everything is normal. Then it became an office: each system is a character with a health bar. A single failure is a sneeze, repeated errors make it sick little by little, a service that is down drops on the spot. The server is the janitor, and he is the one who crosses the building to help whoever fell.
Two rules keep the scene honest. Only the culprit gets sick: whoever depends on something that fell waits at the door, order in hand. And a business backlog is not an illness, it is paper piling up on the desk.
On a computer the model takes clicks: it rotates, zooms and opens a sheet for each system, check by check. On the TV it stays on the overview, and if the machine runs hot the 3D scene gives way to the cards by itself.
A look inside.
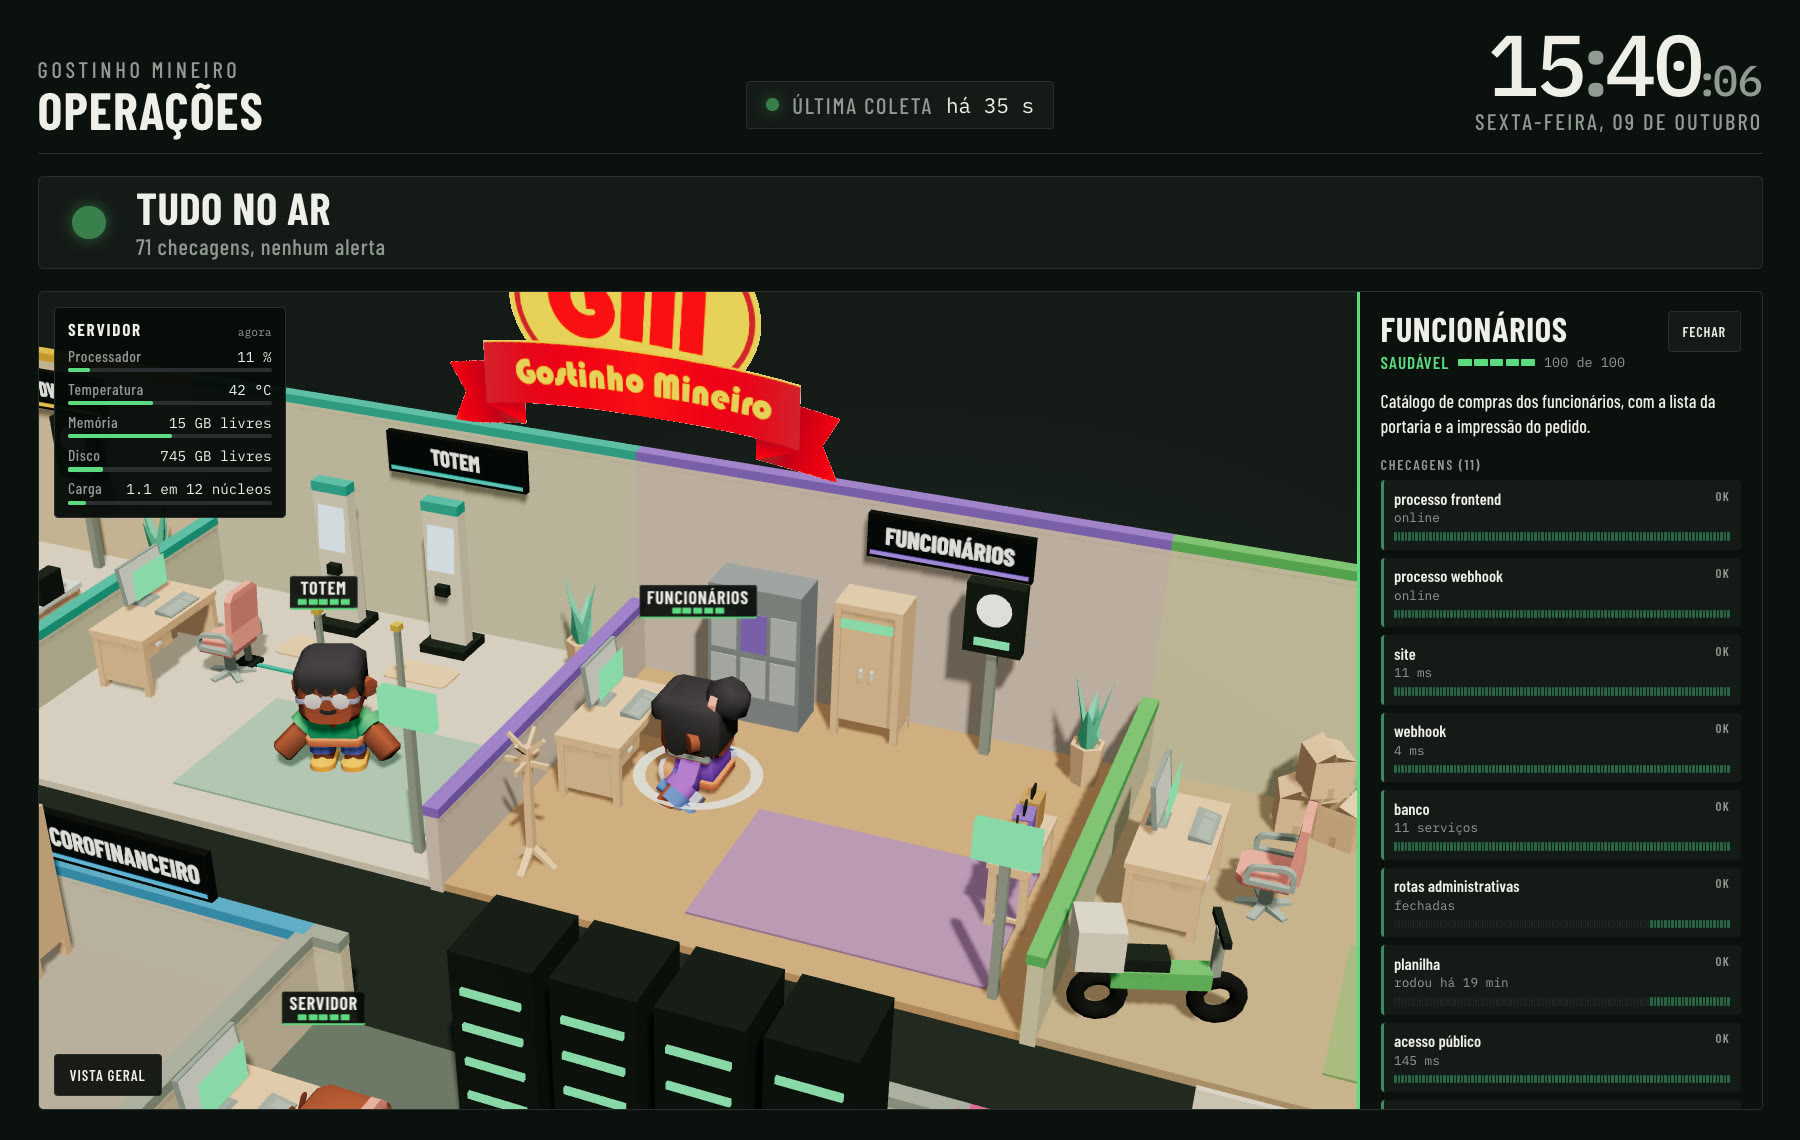
One click on a character zooms the camera in and opens the sheet: what the system is, its health, what it depends on, and each check with the last 24 hours in 15-minute slices. 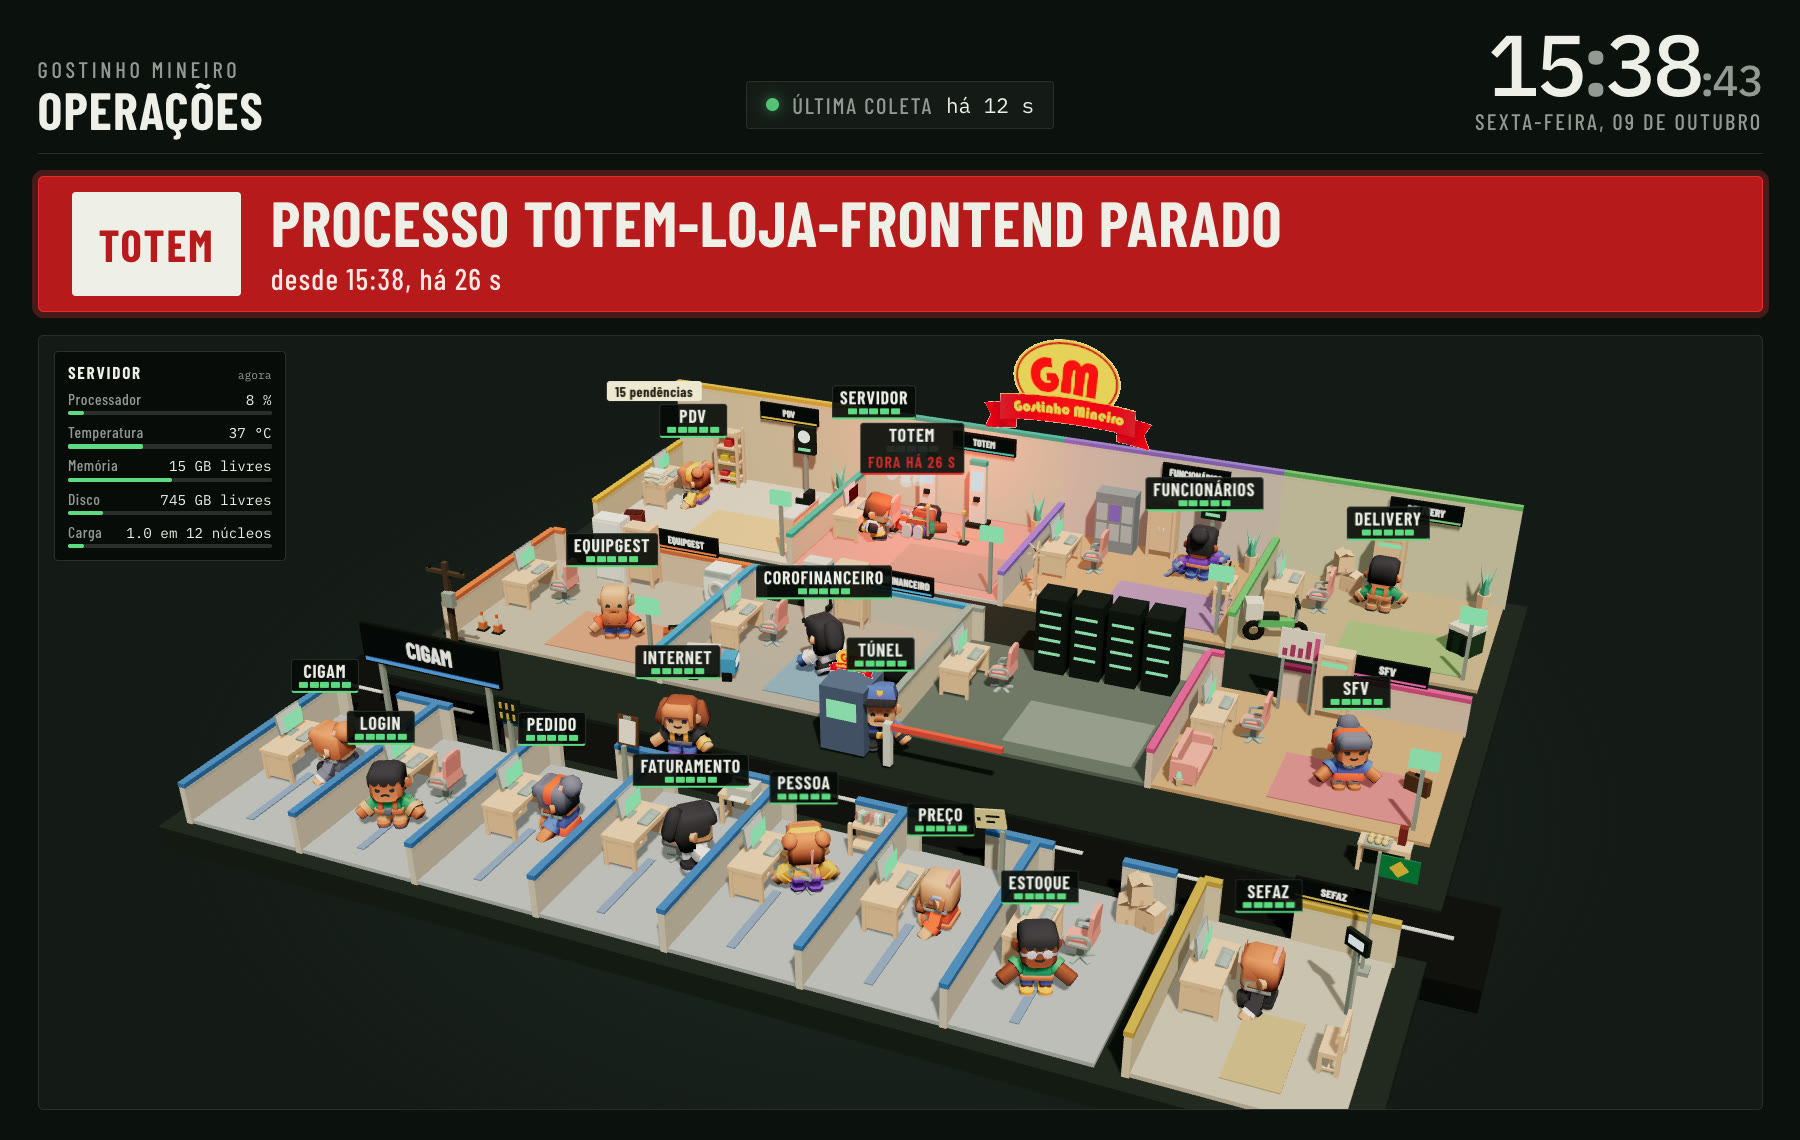
System down: the character falls, the room floor turns red and the top banner says what stopped and since when. The server leaves his room to help. This fall is staged through a URL parameter, nothing was taken down for the picture. 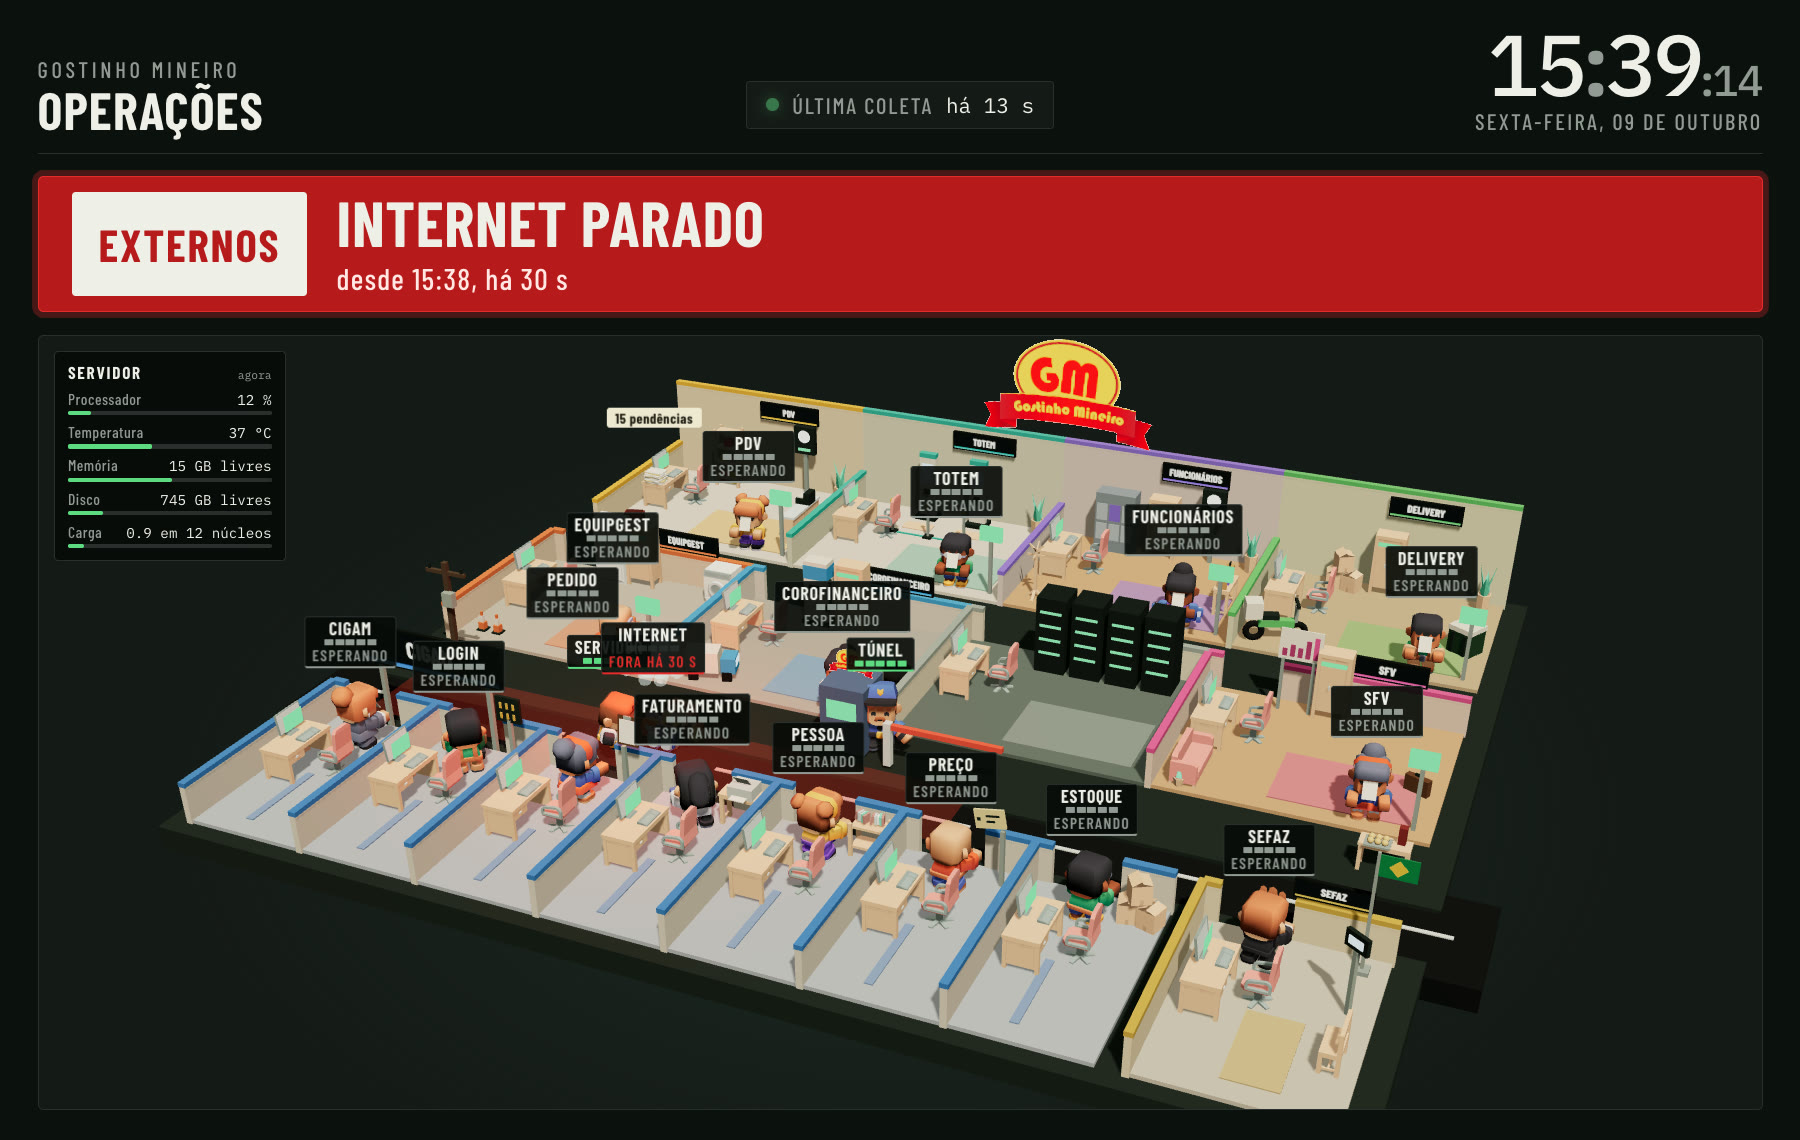
The internet link fell, and it alone gets sick. Whoever depends on it walks to the edge of the room and waits, badge turned grey. That way the screen points at the cause instead of lighting everything red. 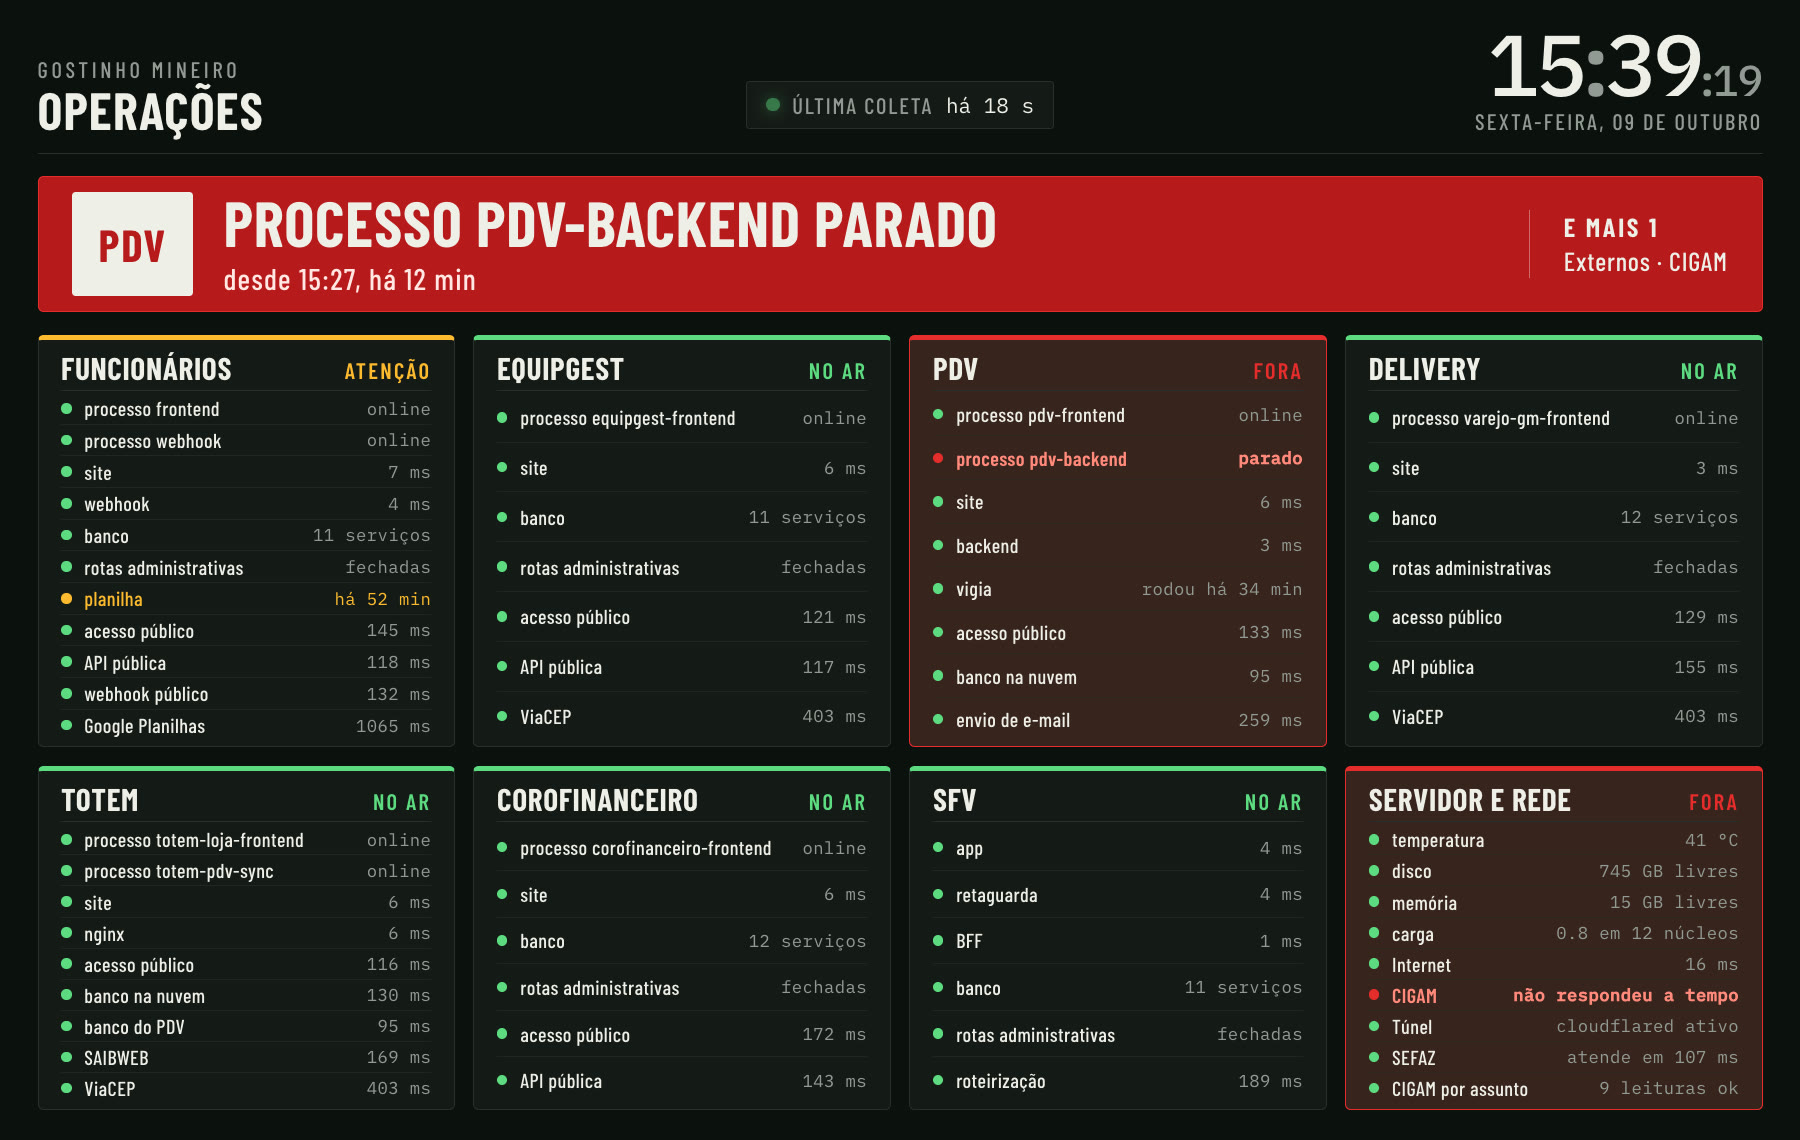
The same information as cards, which is the light version and the one that takes over by itself if the server runs hot. Everything stays dark when normal: colour shows up only on what is off. This alert is simulated too. 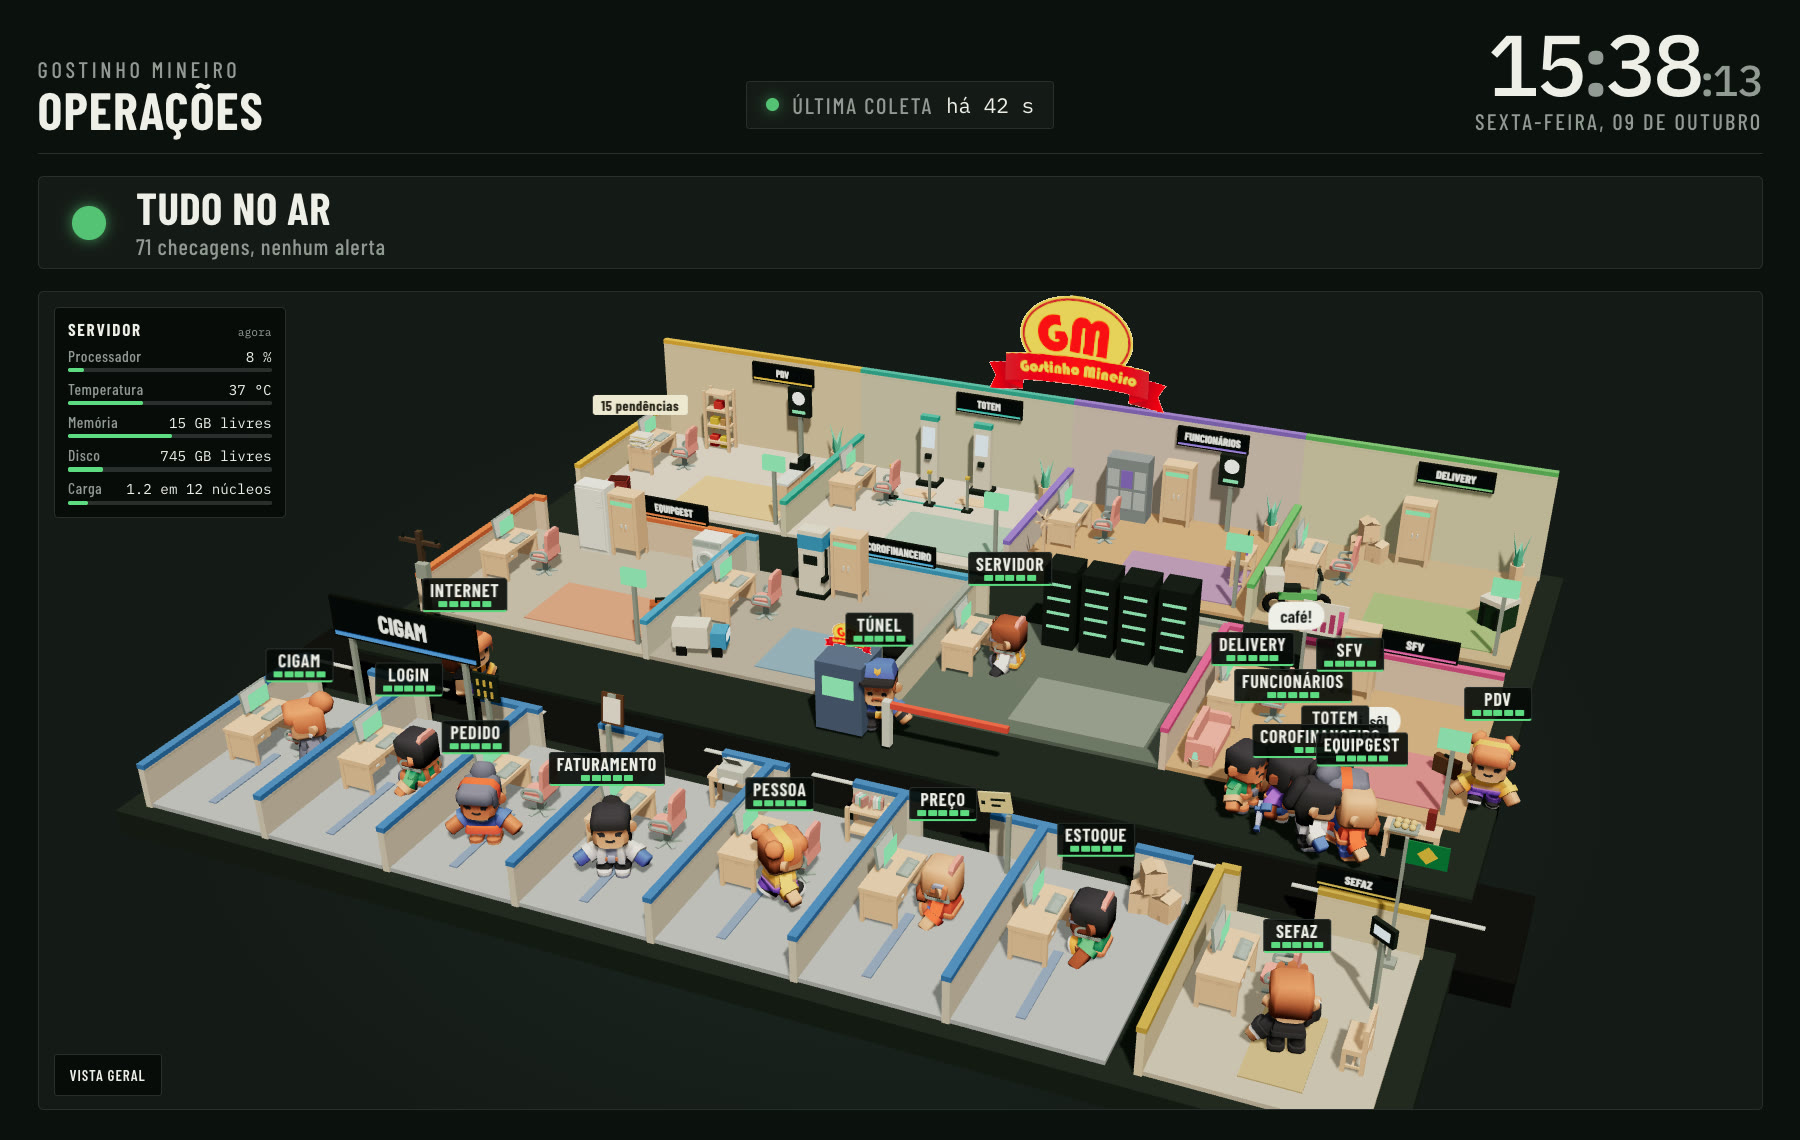
At 10 and at 3:30 pm the in-house crew walks to the table in the yard for cheese bread. It measures nothing. It is what makes someone look at the TV on a day when everything is fine, and that is the day the board still needs to be looked at.